England and Wales form one shared legal system in the UK. Together, they hold a large and growing population. Data from the Office for National Statistics shows that by mid-2024, the total reached about 61.8 million people. Growth has been steady, with pressure rising on housing, transport, and public safety.
The two nations are split into different administrative areas. England has 48 ceremonial counties. Wales is organised into 22 principal areas, often called counties. Each area has its own local risks and policing demands.
Recent 2026 figures from CrimeRate highlight where crime levels are highest. These reports focus on major cities and boroughs rather than small towns. Patterns vary. Some places see higher violent crime. Others face theft or anti-social behaviour.
Table of Contents

Are England and Wales Safe?
England and Wales have long pulled people in. History helps, of course. So does culture. But for many, the real draw is simpler. Work. Stability. A chance to build something steady over time. Cities stay busy. New people arrive every year. Life moves fast, but it works.
Recent figures from the Office for National Statistics give a clearer picture. For the year ending September 2025, there were around 9.3 million recorded crime incidents across England and Wales. That sounds high at first glance. But the trend has not changed much. It has stayed fairly level.
Rates sit close too. Around 68 incidents per 1,000 people in England. Slightly lower in Wales at 66. Some changes stand out. Violent crime has eased, and homicide is down by 7%. That is the lowest level seen in years. Knife-related offences have also dropped by about 9%. Quiet progress, but still progress.
Property crime tells a different story. Burglary has fallen sharp as nearly 20%. Vehicle theft is also down. That is a noticeable shift. Yet not everything moves in the right direction.
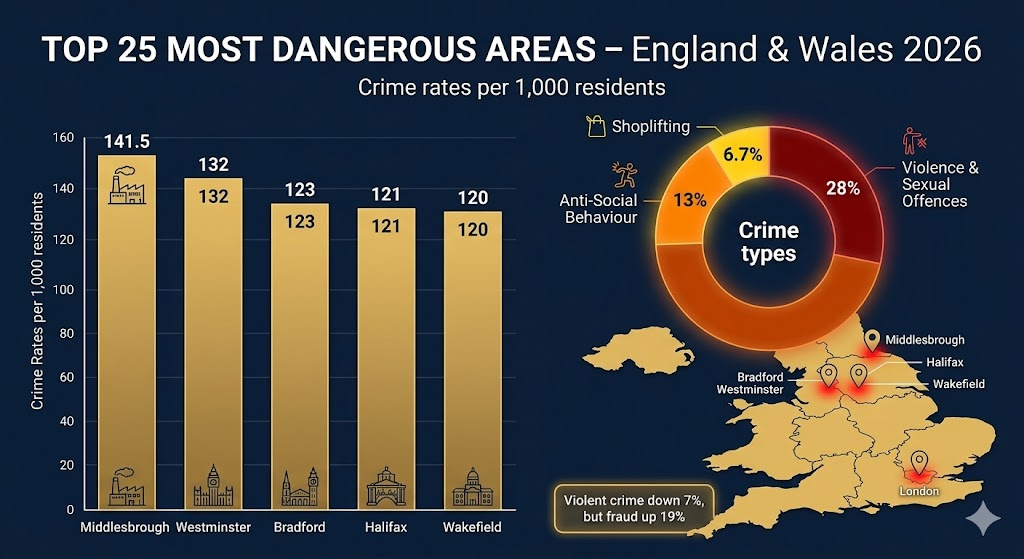
Shoplifting has edged up. Not a huge jump, but enough to raise concern. Fraud is the bigger issue. Bank and credit account fraud has risen by 19%. More crime now happens behind screens, not on streets.
Zoom out, and the wider picture feels steadier. The UK now ranks 30th on the Global Peace Index 2025. A small climb, but meaningful. It suggests something simple. While some areas struggle, the overall system still holds.
A Look at the Most Dangerous Areas in England and Wales
Using data from national authorities, such as Police UK and the Office for National Statistics, we can identify some of the top 25 most dangerous areas in England and Wales based on their crime rates.
25. Swansea
Swansea closes the list with 77 crimes per 1,000 people. Violence and sexual offences lead, making up 40.9%. Robbery remains low, which sets it apart. Still, issues with drugs and public disorder continue to shape local safety concerns across parts of the city.
24. Cardiff
Cardiff reports 80 crimes per 1,000 residents. Violence and sexual offences make up 41.9%. Public order issues stand out, especially on busy weekends. Major sporting events often raise pressure across the city, leading to more incidents in nightlife areas and crowded spaces.
23. Sheffield
Sheffield records 84 crimes per 1,000 residents. Violence and sexual offences account for 42.1%. Overall, it feels calmer than many large cities. Still, burglary and property crime linger in western suburbs. Trends show improvement, but some areas continue to face steady, low-level risk.
22. Coventry
Coventry records 84 crimes per 1,000 residents. Violence and sexual offences lead at 41.5%. A rise in robberies stands out, up by 13.7%. Many incidents happen near transport hubs, where commuters and students often pass through busy, crowded areas.
21. Newcastle-upon-Tyne
Newcastle records 87 crimes per 1,000 residents. Violence and sexual offences make up 40.6%. Nightlife plays a big role here. The Diamond Strip often sees alcohol-related incidents, especially late at night, which drives much of the city’s overall crime figures.
20. Nottingham
Nottingham sees 88.3 crimes per 1,000 residents. Violence and sexual offences lead at 43.7%. Student areas face frequent bike and personal theft. Nightlife zones tell a different story, with higher levels of violent incidents, often linked to late hours and busy crowds.

19. Norwich
Norwich records 89.7 crimes per 1,000 residents. Violence and sexual offences make up 43.2%. It still feels safer than many cities. Yet the centre sees spikes in shoplifting and drug arrests, especially in busy retail streets and crowded public spaces.
18. Portsmouth
Portsmouth records 94.2 crimes per 1,000 residents, lower than older figures. Violence and sexual offences make up 40.7%. Public order issues remain steady. Theft is often reported near the dockyards, where busy movement and tourist activity create more chances for petty crime.
17. Leicester
Leicester records 99 crimes per 1,000 residents. Violence and sexual offences account for 39.3%. The city centre sees steady issues with theft and anti-social behaviour. These incidents shape much of the overall crime picture, especially in busy shopping areas and public spaces.
16. Lincoln
Lincoln reports 102 crimes per 1,000 residents. Violence and sexual offences stand at 39.5%. The city centre shows a different pattern. Shoplifting is a major issue, especially in busy retail streets, where repeat incidents often shape the local crime profile.
15. Peterborough
Peterborough reports 103 crimes per 1,000 residents. Violence and sexual offences account for 40.1%. A sharp rise in drug-related crime stands out, up by 14.4% over the past year. This shift is now the fastest-growing concern across parts of the city.
14. Lincoln
Lincoln, esteemed for its stunning cathedral, historic castle, and other landmarks like the Roman waterway, has a crime rate of 131.6 crimes per 1,000 residents. The most common offences are violent crime, with 4,944 incidents, followed by theft and criminal damage. While the city’s rich history and cultural heritage are major attractions, these crime figures underscore ongoing safety concerns for the city.
13. Northampton
Northampton records 104 crimes per 1,000 residents. Violence and sexual offences lead at 44.3%. The town centre faces steady public order issues. Alcohol-related incidents are common, especially during busy evenings, shaping much of the local crime pattern.
12. Nottingham
Nottingham records 104 crimes per 1,000 residents. Violence and sexual offences make up 39%. Student areas still deal with burglary and theft. Even so, overall theft has dipped by 4% this year, showing a small shift despite ongoing pressure in residential zones.
11. Birmingham
Birmingham records 104 crimes per 1,000 residents. Violence and sexual offences reach 44.5%. Inner-city areas face issues with youth violence and robbery. Yet burglary remains relatively low compared to other major UK cities, giving the overall picture a mixed but shifting feel.

10. Southampton
Southampton records 106 crimes per 1,000 residents. Violence and sexual offences account for 40.7%. Theft stands out here. Shoplifting and other theft are common in busy retail areas, making up close to 15% of yearly reports across the city’s main commercial zones.
9. Liverpool
Liverpool records 107 crimes per 1,000 residents. Violence and sexual offences make up 42.6%. Nightlife areas see more drug-related incidents and public disorder. At the same time, vehicle theft has dropped by 16%, showing a clear shift in the city’s overall crime pattern.
8. Leeds
Leeds records 108.4 crimes per 1,000 residents. Violence and sexual offences make up 42.8%. The city sits above the regional average. Most pressure falls on the centre, especially Hunslet and Riverside, where retail theft and evening disorder shape the local crime pattern.
7. Hull (Kingston upon Hull)
Hull records 114 crimes per 1,000 residents. Violence and sexual offences make up 37.2%. The city has long faced issues with damage and arson. New Action Zone work has helped ease anti-social behaviour, especially in central areas, though some concerns still remain.
6. Wakefield
Wakefield records 120 crimes per 1,000 residents. Violence and sexual offences make up 40.8%. Theft and shoplifting are rising year on year. In contrast, burglary has dropped by 14%, helped by stronger local policing and better prevention across residential areas.
5. Halifax
Halifax records 121 crimes per 1,000 residents. Violence and sexual offences make up 41.5%. Reports have edged up in recent months. Public order issues and criminal damage are common, especially in central districts, where activity stays high and incidents tend to cluster.
4. Bradford
Bradford records 123 crimes per 1,000 residents. Violence and sexual offences make up 42.1%. Inner-city areas see rising drug cases and weapon possession. At the same time, burglary has started to fall, showing a mixed trend across different parts of the city.
3. Westminster (London)
Westminster records 132 crimes per 1,000 daytime residents. Theft and robbery lead at about 45.6%. The area sees heavy footfall every day. Pickpocketing is common, especially in places like Soho and Covent Garden, where crowds create easy chances for theft.
2. Blackpool
Blackpool records 133 crimes per 1,000 residents. Violence and sexual offences make up 38.7%. Visitor numbers shape the pattern here. Busy summer periods bring more anti-social behaviour and shoplifting, especially along the central promenade where crowds gather and movement stays constant.
1. Middlesbrough
Middlesbrough records 141.5 crimes per 1,000 residents. Violence and sexual offences make up around 39.5%. The city faces deeper challenges in some areas. Public disorder and criminal damage remain high, often tied to local economic pressure and uneven conditions across certain wards.
A Summary of the Worst Crime Rates in England and Wales
| Rank | Area in England and Wales | Crime Rate per 1,000 People |
|---|---|---|
| 25th | Swansea | 77.2 |
| 24th | Cardiff | 80.7 |
| 23rd | Coventry | 84.2 |
| 22nd | Sheffield | 84.6 |
| 21st | Southend-on-Sea | 86.5 |
| 20th | Newcastle upon Tyne | 87.5 |
| 19th | Norwich | 89.7 |
| 18th | Plymouth | 96.5 |
| 17th | Derby | 98.5 |
| 16th | Leicester | 99.9 |
| 15th | Lincoln | 102.0 |
| 14th | Bristol | 102.0 |
| 13th | Peterborough | 103.0 |
| 12th | Northampton | 104.0 |
| 11th | Nottingham | 104.3 |
| 10th | Birmingham | 104.4 |
| 9th | Liverpool | 106.5 |
| 8th | Leeds | 108.4 |
| 7th | Southampton | 109.8 |
| 6th | Kingston upon Hull | 114.0 |
| 5th | Wakefield | 120.0 |
| 4th | Halifax | 121.0 |
| 3rd | Bradford | 123.5 |
| 2nd | Westminster | 131.6 |
| 1st | Middlesbrough | 141.3 |

A Breakdown on the Types of Crime in England and Wales
According to Crimerate, England recorded 87 crimes per 1,000 people in the 12 months leading up to September 2024. By examining the data they gathered, we’ve identified the most common types of crime in the country.
| Type of Crime | Crime Count | Crime Rate per 1,000 People |
|---|---|---|
| Violence and Sexual Offences | 1,870,154 | 28% |
| Anti-Social Behaviour | 866,498 | 13% |
| Shoplifting | 443,529 | 6.70% |
| Criminal Damage and Arson | 382,804 | 5.80% |
| Other Theft | 357,947 | 5.44% |
| Public Order | 361,176 | 5.45% |
| Vehicle Crime | 277,140 | 4.19% |
| Burglary | 199,059 | 3.02% |
| Drugs | 190,578 | 2.90% |
| Theft from the Person | 108,417 | 1.65% |
| Other Crime | 115,595 | 1.73% |
| Robbery | 74,495 | 1.12% |
| Bicycle Theft | 46,663 | 0.72% |
| Possession of Weapons | 51,822 | 0.77% |
Is There More Crime in England or Wales?
Crime levels can look high at first glance. But the pattern is more stable than it seems. For the twelve months ending January 2026, England recorded about 68 crimes per 1,000 people. Violence and sexual offences remain the most common. Roughly 28 cases appear per 1,000 daytime population, which shows where most pressure sits.
Some areas face more risk than others. Halifax stands out as the most dangerous among larger towns and cities. This ranking comes from CrimeRate’s scoring system, which weighs serious offences more heavily than lower-level crime. Bradford follows next, with Wakefield close behind.
On the other side, a few areas show lower risk. West Bromwich ranks as the safest, with Dewsbury next. Birmingham also sits lower than expected when adjusted for crime severity. This shows one clear point. Crime is not evenly spread. It shifts by place, not just numbers.
Conclusion
In this article, we’ve examined the top 25 most dangerous areas in England and Wales. Like any country, England and Wales have counties, cities, villages, and even towns, with varying levels of safety.
For this reason, it’s important for businesses to implement effective security measures to protect their staff and property. One of the best ways to minimise the risk of crime is by hiring a professional security company. These experts can monitor CCTV, provide on-site security guards to deter potential offenders, and evaluate your current security systems, offering recommendations to strengthen your organisation’s overall safety.
For the latest insights on England and Wales, be sure to visit our News & Insights page, where you’ll find articles like How to Stay Safe from Knife Crime. You can also check out our YouTube channel for valuable security tips, facts, and statistics.
Frequently Asked Questions
1. Is crime rising across England and Wales?
Not really. We see small shifts, but overall levels stay quite steady year to year.
2. Which crimes happen most often?
We find that violence and sexual offences appear the most across many areas.
3. Why do some cities rank higher than others?
We look at severity, not just totals. Serious crimes carry more weight in rankings.
4. Are big cities always more dangerous?
No. Some large places score lower once crime type and impact are adjusted.
5. Can a place feel safe but still rank high?
Yes. Local spikes or specific crime types can affect rankings without changing daily life much.